When
balloons inflate, it is typically a long and slow process and always difficult
to tell when they are full. Towards the end, the balloon stretches and
stretches, making room for those last few short breaths. When you've
reached the end though, it just doesn't feel right and you start to think more
cautiously. Of course as we all know, balloons burst. Once that
magical maximum capacity is reached, the balloon
POPS
in spectacular fashion, exploding with vigor - loudly and violently.
There
are three phases in the trajectory of the current fully-heated high yield
market: 1) Overbought conditions, 2) Rate tantrums, and 3) Defaults.
Overbought Conditions
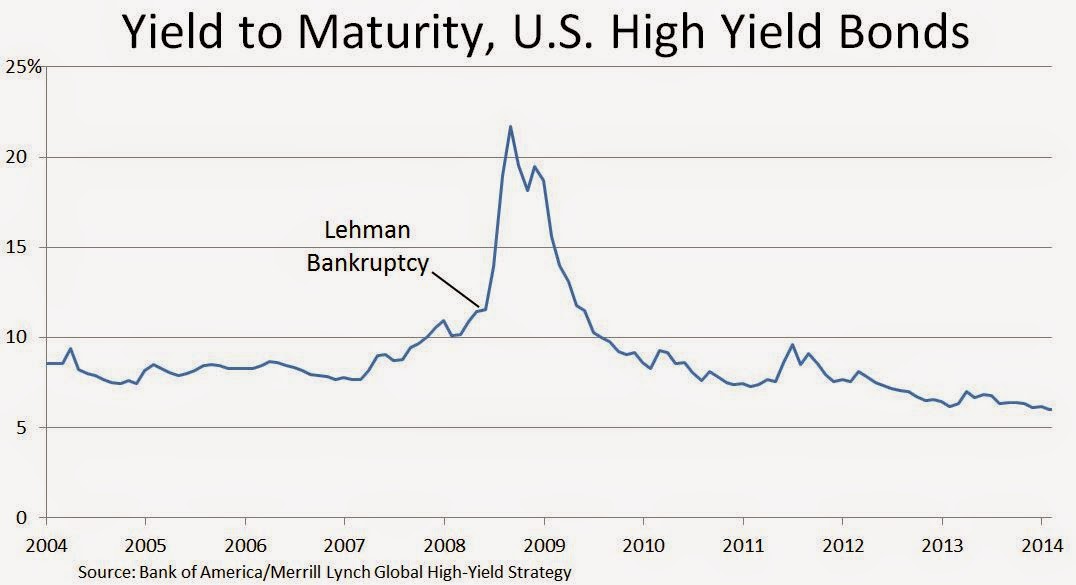
Clearly we have been in "Overbought"
territory for quite some time. According to the BAML Master High Yield
Index, the average current high yield bond price is 104.10. The average
new issue clearing yield is 6.28%, down from 7.33% two years ago. In the
last year alone, the CCC new issue clearing yield has fallen from 8.77% to
7.79%. The average yield-to-maturity is 6.18%, down from 7.35% two years
ago.
Forward calendar volume is already
starting to reflect a small amount of hesitation in appetite, coming in at 19%
lower than this time last year. After growing rapidly over the past
10-15 years, high yield now comprises roughly 15% of the overall corporate
(investment grade) bond market, which itself is estimated at roughly $9.8
trillion, trailing the U.S. Treasury market ($12.1 trillion outstanding) but
larger than the municipal bond market ($3.7 trillion outstanding), according to
first-half 2014 estimates by industry trade group Securities Industry and
Financial Markets Association (SIFMA). In 1996, the high yield
market was $200 billion.
As
the market has grown and issuance has exploded, Cov-Lite, PIK and PIK-Toggle
issuance has had a resurgence, on pace to surpass the most recent highest
annual volume in 2008. PIKs
are viewed as more highly speculative debt securities. Essentially, the
company through in-kind payment is creating more debt in a situation where it
doesn’t have the capital to service the debt. This blatant disregard for
credit risk among the already obvious reach for yield is clearly setting up the
next default cycle.
Rate
Tantrums
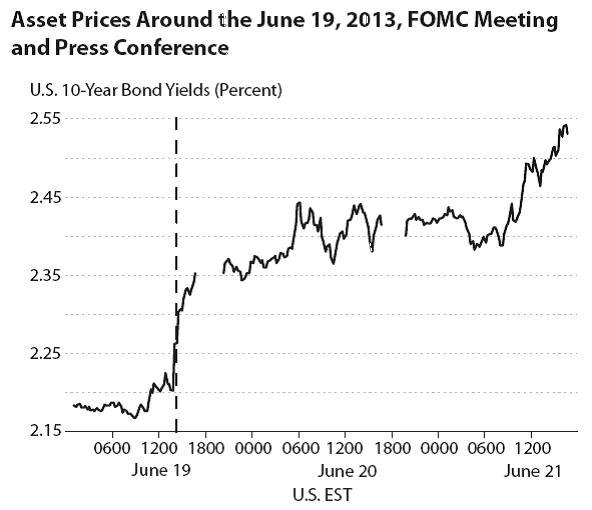
On
May 22, 2013, Former Fed Chairman Ben Bernanke announced that the Central Bank
would begin scaling back its monthly asset purchase program. This was
followed up with a June 19th press conference, where he optimistically
described then-current economic conditions, and reiterated that the taper would
commence later in 2013. In the next 48 hours, the 10Y Treasury yield rose
approximately 35 bps, from 2.20% to 2.55%. The 10Y Treasury yield hit 3%
by the end of 2013.
The
value of the USD vs other currencies also rose significantly on the
announcement, with some EM FX falling as much as 15-20% vs the USD. In
the four weeks following the May 22nd announcement, high yield ETFs and mutual
funds saw $12.3 billion in redemptions. This alarming outflow was only
recently surpassed by outflows in the July-August 2014 technical sell-off
($12.6 billion in outflows). Given that the Fed makes up approximately
90% of the new-issue MBS purchases, the reaction in the mortgage market was
even more violent. Annaly (NLY), a well-known mortgage REIT, lost 35% of
its value from the date of the announcement to the end of 2013.
The
stock market continued to show relative strength though, only selling off
approximately 5.5% in the month following the original announcement.
These collective reactions caused what is now referred to as "Taper
Tantrum".
The
nervousness in the market about a new and improved tantrum is starting to
become evident. Bloomberg reported caution from UBS and other market
participants last week. Larry Hatheway, UBS's Chief Economist said, “The main show is soon to
arrive. With the ‘taper’ nearly complete, there are fundamental and
institutional reasons aplenty to fret that last summer’s ‘taper tantrum’ will
be find its sequel. Beware ‘rate rage.’”. The Barron's this weekend is
calling for significant forthcoming volatility in the bond market, suggesting
that the announcement to raise rates may come as soon as the Fed's September
16th meeting. As US Treasury yields hit lows due to geopolitical concerns
and buying from sovereign debt relative value players, the rise could catch
many off-guard, despite pretty much everybody knowing in their heart that it's
coming.
Investors notoriously chase
returns. The St. Louis Fed recently wrote a paper on the dangers of
chasing returns (it was focused on equity mutual funds, but the premise holds
true), which pointed to a high correlation of flows to past returns, of course
resulting in inflows at exactly the wrong time. Despite the recent ETF
& mutual fund outflow hiccup in high yield, overall growth of the market
has been unprecedented since 2010. Some ETF operators have even caught on
to the fear of rising rates, putting together what the Barron's expects could
be a recipe for disaster - Long High Yield ETFs hedged with Short Treasuries.
(Although I agree that interest rates will rise over time, perhaps
significantly, in the fickle world of trigger-finger happy retail investors, at
the first sign of a risk-off environment these products could lose on both
sides of the trade. Investors thought all they were doing was protecting
their coupon, when in reality they were ignoring credit quality again.)
Defaults
Dr. Ed Altman, a world renowned
expert on corporate bankruptcy, is an advisor to our short-biased high yield
fund, and has conducted in depth research on the current credit bubble.
The current benign credit cycle, which has been near or below 2% for the
last five years, is expected to considerably increase over the next three to
five years. Without taking the currently fully heated credit environment
into account, it is clear that high yield default rates are incredibly
cyclical. The average annual default rate since 1971 is 3.14%, with below
average default cycles lasting three to four years typically, and above average
default cycles lasting one to two years. Any sustained period of
extraordinarily low defaults has typically been followed by a significant spike
in default rates.
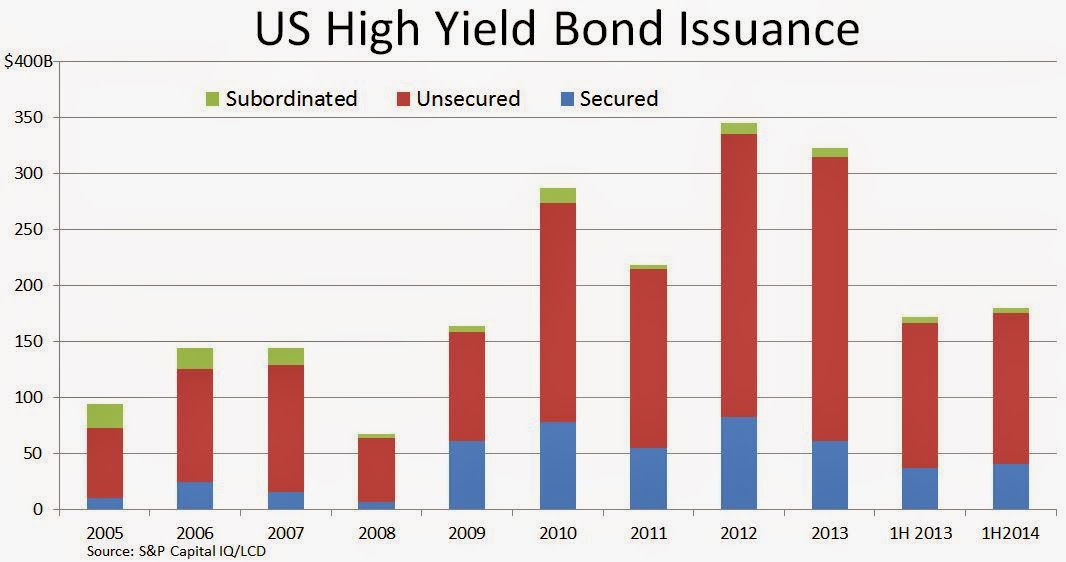
The
corporate high yield sector has been refinancing and increasing their debt
significantly and consistently since the current benign credit cycle started in
2010. New high yield issuance topped $200 billion for the first time ever
in 2010. 2011 new high yield issuance was just below $200 billion, and
2012, 2013 and 2014 (the pace through the 1st half) have all topped $200
billion since.
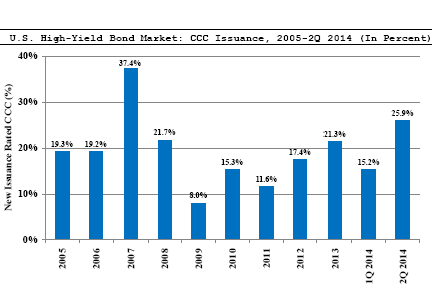
Issuance
is unprecedented, and the quality of that issuance is clearly suspect, with CCC
issuance 21.5% of all high yield issuance, a figure not topped since 2008.
The 2nd quarter's CCC issuance jumped to 25.9% of total high yield
issuance, a figure only second to the all-time record in 2007. The
five-year cumulative mortality rate for CCC's is 47.4%, a sobering statistic
given the amount of low-rated debt issuance since 2010. 46% of the 1st
half high yield issuance was Cov-Lite, another factor which typically results
in lower recovery rates should the debtor company default. Dr. Altman's
well-known Z-Score metric, which quantifies a company's probability of default,
shows that the credit quality of companies in the peak of the current cycle is
lower than that of the last cycle peak in 2007.
Marty
Fridson's recent study suggested that the next default upsurge may be $1.576
trillion of face value between 2016 and 2020, a startling prediction given high
yield's lofty status, which on average continues to trade well above par.
The price of weak credits typically fall well before the default rate
spikes. As an example, we point to 2007 and 2008 where the default rate
was below 2% for every month except December 2008. By the time the big
spike in defaults occurred, the recovery (and QE) were already well in place.
Please
enjoy your Labor Day and be safe. I will be in NYC tomorrow for meetings
if you'd like to meet, and I'll be at Citi Field for a Goldman event on
Thursday (followed most likely by the US Open) if you'd like to catch up then.
We look forward to speaking with most of you in further detail about the
current opportunity set throughout the next few months.
Richard
Travia
Director
of Research


